Getting started
The easiest way to get started with baec is in the Jupyter Notebook.
Installation
To install this package, including the basetime reading functionality, run:
pip install baec[aws]
To skip the installation of the optional library, in case you do not need it (e.g. not connecting to the aws server), run:
pip install baec
Than you can import baec as follows:
In [1]: import os

In [2]: import matplotlib.pyplot as plt

In [3]: import pandas as pd

In [4]: from baec.measurements.io.zbase import measurements_from_zbase
or any equivalent import statement.
SettlementRodMeasurementSeries
The first thing to do is to create SettlementRodMeasurementSeries classes. This class holds the information of a selection of Measurements.
For more information on the baec.measurements.settlement_rod_measurement_series
.SettlementRodMeasurementSeries() class go the the reference.
In [5]: root = os.environ["DOC_PATH"]

In [6]: filepath = os.path.join(root, "_static/data/E790M.csv")

# Create series from zbase csv file
In [7]: measurements = measurements_from_zbase(
   ...:     filepath_or_buffer=filepath, project_name="Docs"
   ...: )
   ...:

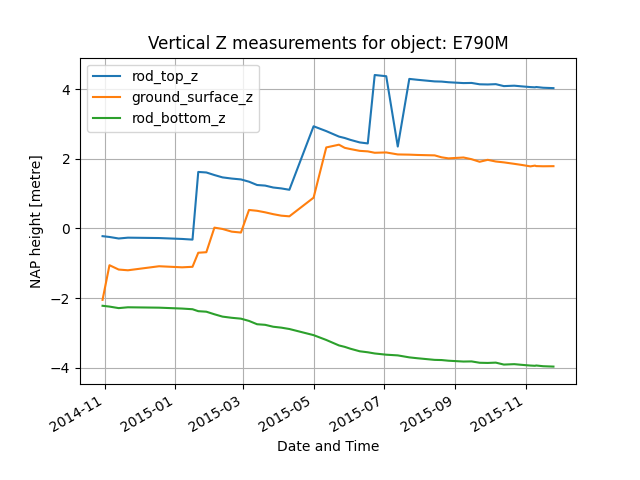
# plot measurements
In [8]: measurements.plot_z_time()
Out[8]: <Axes: title={'center': 'Vertical Z measurements for object: E790M'}, xlabel='Date and Time', ylabel='NAP height [metre]'>

MeasuredSettlementSeries
The next step is to transform the SettlementRodMeasurementSeries to a MeasuredSettlementSeries. Based on the start date the displacements are calculated.
For more information on the baec.measurements.measured_settlement_series.MeasuredSettlementSeries()
class go the the reference.
In [9]: import datetime

In [10]: from baec.measurements.measured_settlement_series import MeasuredSettlementSeries

# Create series from measurements
In [11]: series = MeasuredSettlementSeries(
   ....:     measurements,
   ....:     start_date_time=measurements.measurements[0].date_time
   ....:     + datetime.timedelta(days=200),
   ....: )
   ....:

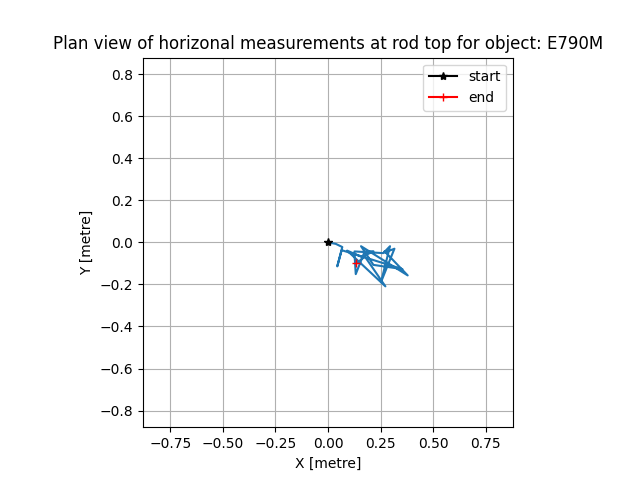
# plot displacements
In [12]: series.plot_xy_displacements_plan_view()
Out[12]: <Axes: title={'center': 'Plan view of horizonal measurements at rod top for object: E790M'}, xlabel='X [metre]', ylabel='Y [metre]'>
