Getting started
The easiest way to get started with BROmodels is in the Nuclei Notebooks.
Installation
To install this package, including the map and gef reading functionality, run:
pip install bromodels
Than you can import BROmodels as follows:
In [1]: import bromodels
or any equivalent import statement.
How to use BROmodels repo?
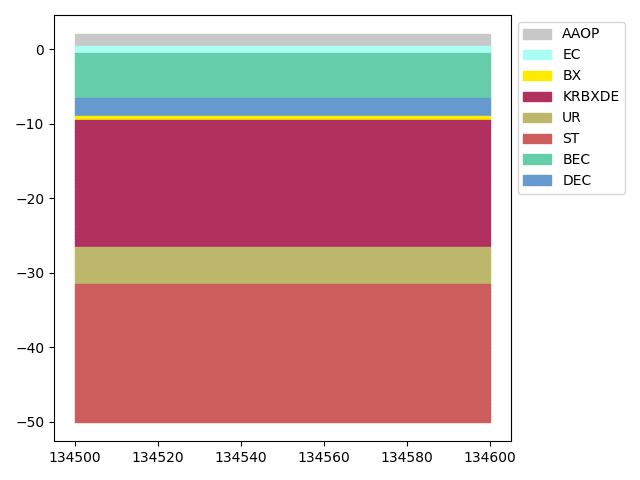
How to plot a GeoTop column?:
In [2]: import bromodels

In [3]: import matplotlib.pyplot as plt

In [4]: import matplotlib.patches as mpatches

In [5]: _link = {
   ...:     "lithok": (bromodels.GeoTop.geotop_lithology_class(), "LITHO_CLASS_CD"),
   ...:     "strat": (bromodels.GeoTop.geotop_stratigraphic_unit(), "STR_UNIT_CD"),
   ...: }
   ...:

# get data
In [6]: soildata = bromodels.GeoTopColumn()

In [7]: soildata
Out[7]:
<xarray.Dataset> Size: 6kB
Dimensions:  (z: 104)
Coordinates:
    x        int32 4B 134500
    y        int32 4B 454400
  * z        (z) float32 416B 1.5 1.0 0.5 0.0 -0.5 ... -48.5 -49.0 -49.5 -50.0
Data variables: (12/13)
    strat    (z) float32 416B 1e+03 1e+03 1e+03 ... 5.07e+03 5.07e+03 5.07e+03
    lithok   (z) float32 416B 0.0 0.0 0.0 6.0 3.0 3.0 ... 3.0 6.0 6.0 6.0 6.0
    kans_1   (z) float32 416B ...
    kans_2   (z) float32 416B ...
    kans_3   (z) float32 416B ...
    kans_4   (z) float32 416B ...
    ...       ...
    kans_6   (z) float32 416B ...
    kans_7   (z) float32 416B ...
    kans_8   (z) float32 416B ...
    kans_9   (z) float32 416B ...
    onz_lk   (z) float32 416B ...
    onz_ls   (z) float32 416B ...
Attributes:
    title:         geotop v01r6 (100.0m * 100.0m * 0.5m
    references:    http://www.dinoloket.nl/detaillering-van-de-bovenste-lagen...
    comment:       GeoTOP 1.6 (lithoklasse)
    disclaimer:    http://www.dinoloket.nl
    terms_of_use:  http://www.dinoloket.nl
    institution:   TNO / Geologische Dienst Nederland
    Conventions:   CF-1.4
    source:        Generated by nl.tno.dino.geo3dmodel.generator.GeoTOPVoxelM...
    history:       Generated on Thu Oct 05 17:01:25 CEST 2023
# set variable
In [8]: var = "strat"

# create plot
In [9]: fig, ax = plt.subplots()

In [10]: df, CD = _link[var]

In [11]: for z, nr in zip(soildata.z.values, soildata[var].values):
   ....:     ax.fill_between(
   ....:         [soildata.x.values, soildata.x.values + 100],
   ....:         z + 0.5,
   ....:         z,
   ....:         color=df.loc[df["VOXEL_NR"] == nr][
   ....:             ["RED_DEC", "GREEN_DEC", "BLUE_DEC"]
   ....:         ].to_numpy()
   ....:         / 255,
   ....:     )
   ....:

In [12]: patch_list = []

In [13]: for i, row in df.loc[df["VOXEL_NR"].isin(soildata[var].values)].iterrows():
   ....:     data_key = mpatches.Patch(
   ....:         color=(row.RED_DEC / 255, row.GREEN_DEC / 255, row.BLUE_DEC / 255),
   ....:         label=row[CD],
   ....:     )
   ....:     patch_list.append(data_key)
   ....:

In [14]: plt.legend(handles=patch_list, bbox_to_anchor=(1, 1), loc="upper left")
Out[14]: <matplotlib.legend.Legend at 0x7f471b804b50>

In [15]: plt.tight_layout()

More information about other user cases following soon!